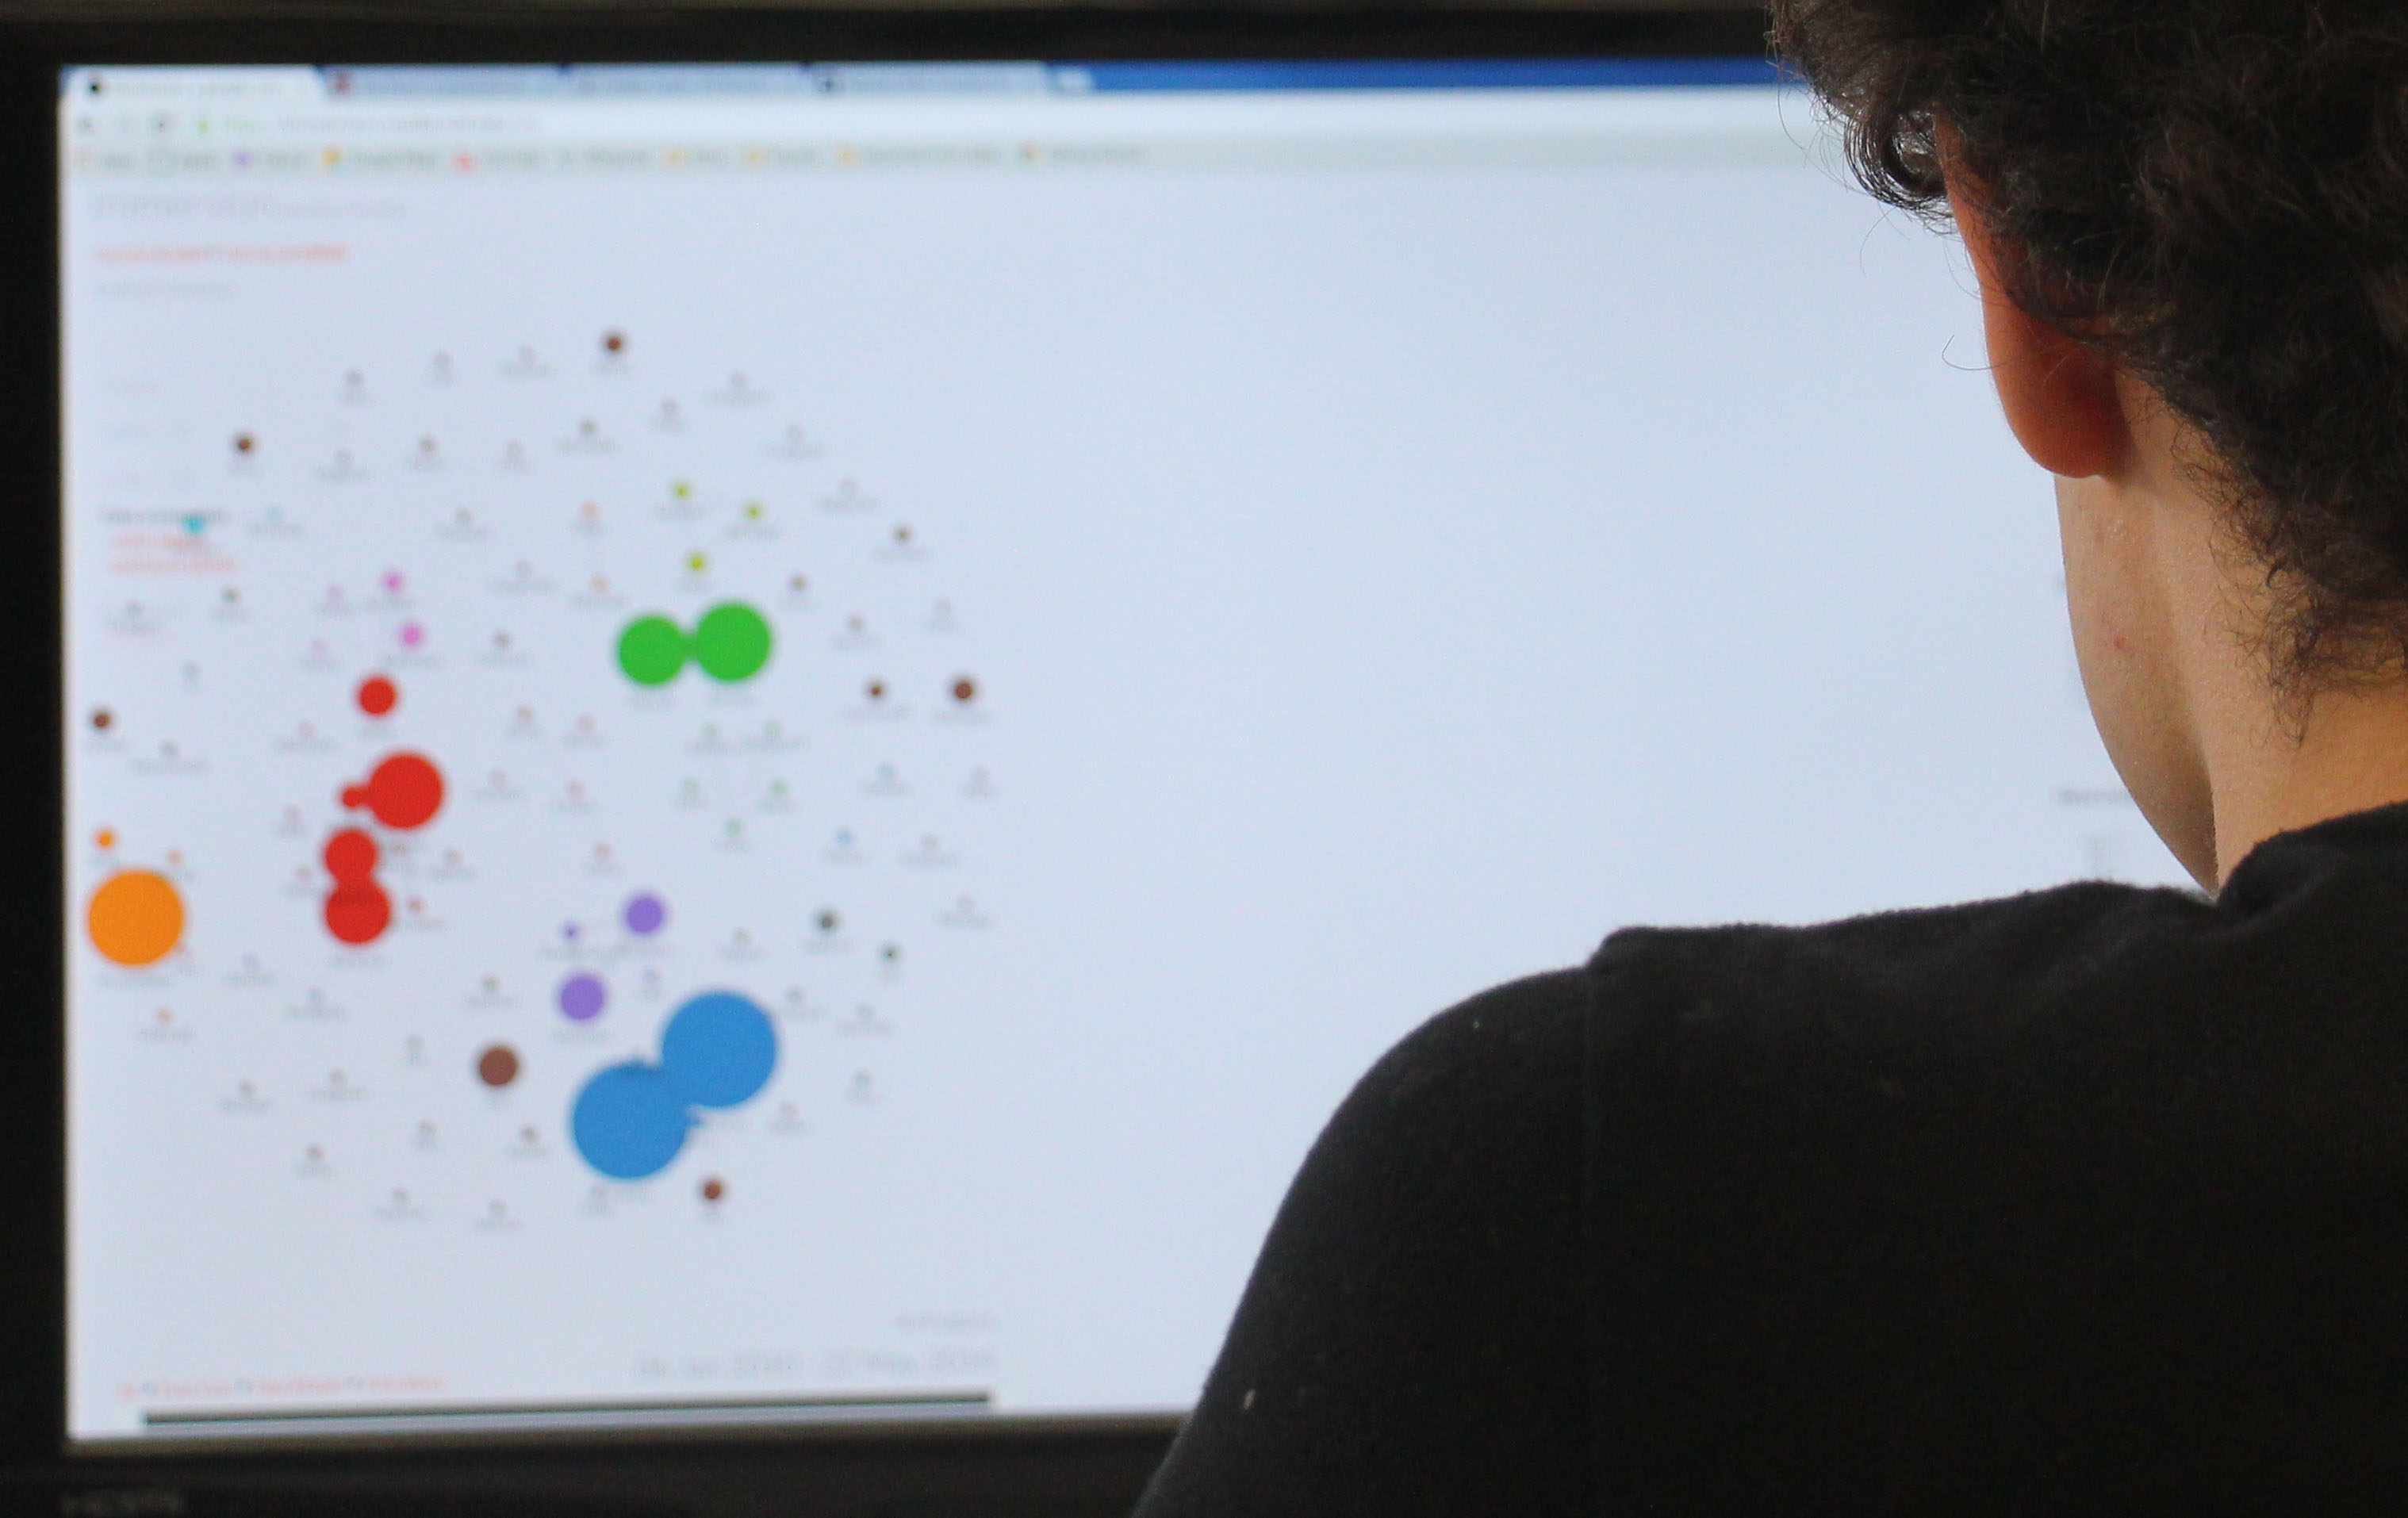
Photo by Alison Myers, courtesy of VIVA
We are in the midst of a veritable information explosion. In the digital universe, we create, capture and store facts and figures at unprecedented rates on every topic imaginable. It has led to a unique 21st-century problem: Big Data overload. How can we possibly sift through the massive fog of complex and confounding data and make sense of it?
UBC researchers are developing the field of visual analytics to find the answers. This multidisciplinary field combines research in both computer science and psychology to create systems that turn vast quantities of interrelated information into visual images and patterns that are easily understood by the human brain.
In the same way that bar graphs and pie charts have helped us understand simple relationships between data, visual analytics is finding ways for us to understand relationships within even the most complex data sets.
By imposing the right kind of order on the chaos of data, visual analytics enables us to leverage uniquely human abilities—such as reasoning, problem-solving, and raw visual intelligence—to analyze the data.
“It’s a marriage of sorts, blending complex computational processes with human cognitive abilities to let us quickly see the hidden gems of knowledge contained within diverse sets of data,” explains UBC Computer Science and Psychology Professor Ronald Rensink.
In 2004, UBC incorporated its pioneering visual analytics research into the Media and Graphic Interdisciplinary Centre (MAGIC), which gathers academics from fields as diverse as music, graphic arts and computer science together under one roof.
Since then, researchers at MAGIC have been creating visual representations of large volumes of complex data, leading to improvements in areas as diverse as aircraft safety, childhood injuries and disaster relief.
These examples are just the beginning. Visual analytics can bring data to life in virtually every sector and topic imaginable, and the university is helping to do just that through the Vancouver Institute for Visual Analytics (VIVA), a collaborative project between UBC, Simon Fraser University and the British Columbia Institute of Technology.
Born out of a series of collaborations with the Boeing Company, VIVA bridges academic theory with real-life practice by connecting researcher with industry, as well as offering training courses to anyone—students, researchers, government or members of the public—interested in rendering massive, interlinked amounts of data comprehensible through images.
“Visual analytics is like using technology to find a needle in a haystack,” says Rensink. “It allows us to pick out patterns, context and connections from data that would otherwise be too overwhelming on its own. Ultimately, it allows us, often at a glance, to better understand today’s world.”